Linux uptime Command Explained for Beginners
The Linux uptime command gives you a fast health check for a machine.
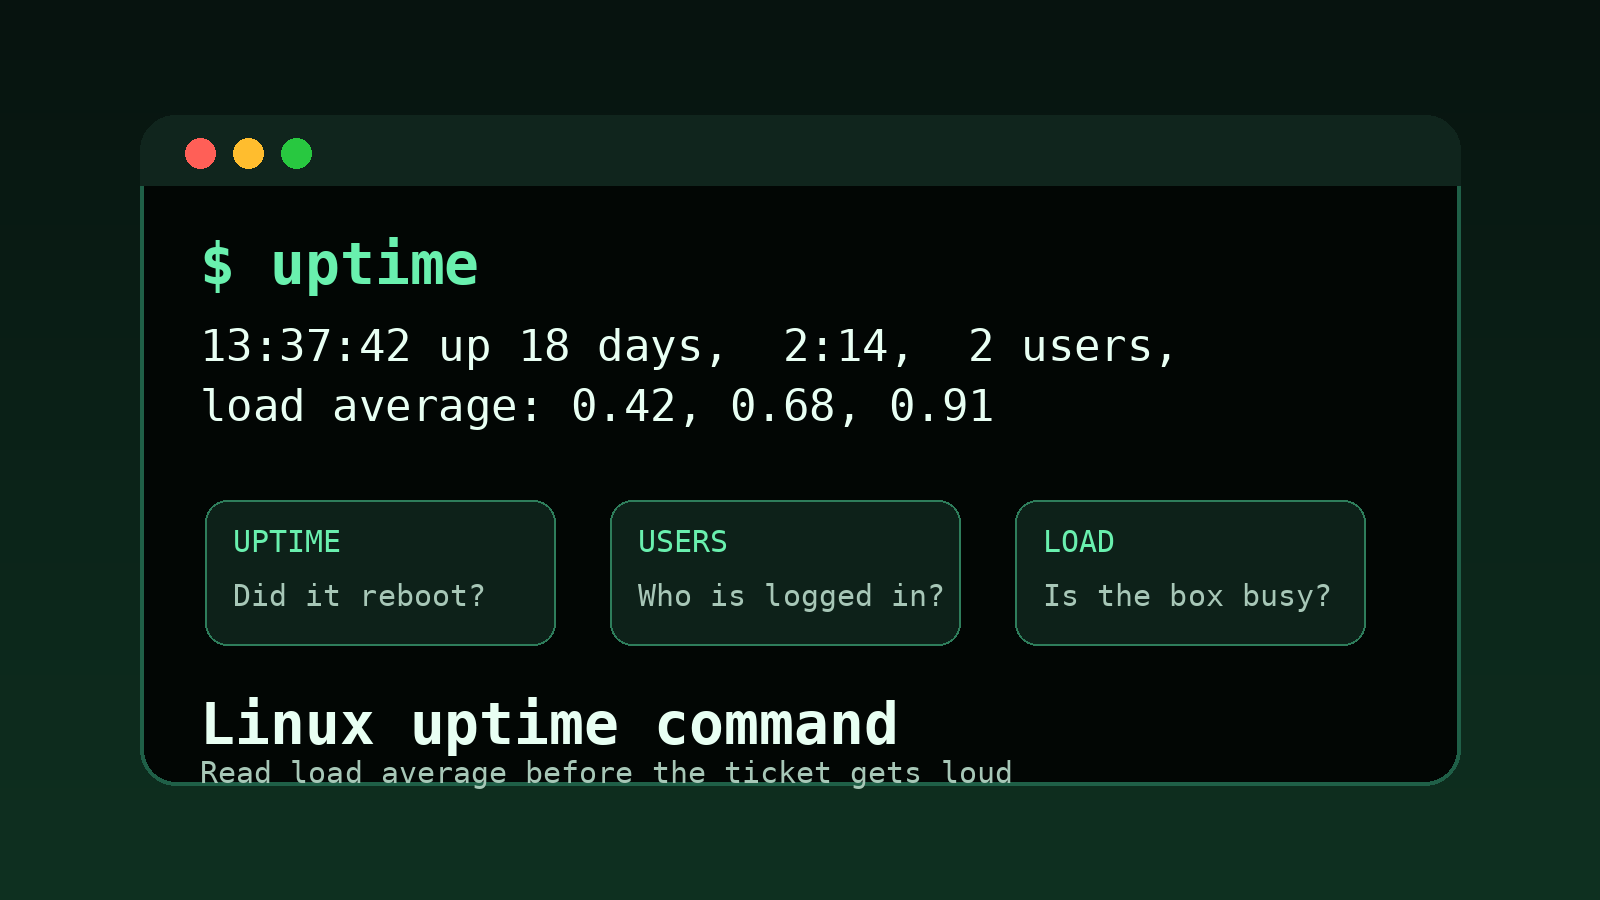
It tells you three useful things in one line: how long the system has been running, how many users are logged in, and the current load average. That may sound tiny, but in help desk and junior sysadmin work, this is often the first command that tells you whether a server recently rebooted, whether somebody else is logged in, and whether the machine is working harder than it should.
The beginner mistake is treating uptime like a magic “server is good” or “server is bad” meter. It is not that. It is a quick clue. Think of it as the first sticky note on the ticket, not the whole investigation.
This guide explains how to read uptime, what load average means, how to compare load to CPU cores, and what to check next when the numbers look suspicious.
The basic uptime command
Run:
uptimeYou might see output like this:
14:32:18 up 12 days, 4:16, 2 users, load average: 0.22, 0.35, 0.41That one line gives you several clues:
| Part | Example | What it means |
|---|---|---|
| Current time | 14:32:18 | The system’s current time |
| Uptime | up 12 days, 4:16 | How long since the last boot |
| Users | 2 users | Logged-in user sessions |
| Load average | 0.22, 0.35, 0.41 | Average system load over 1, 5, and 15 minutes |
For a beginner, the most important part is learning not to panic at the wrong number.
What uptime tells you first
uptime is useful because it answers common support questions quickly.
If a user says, “the server rebooted overnight,” you can check:
uptimeIf it says:
up 17 minutesthen yes, something rebooted recently. That does not tell you why, but it tells you the complaint is worth investigating.
If it says:
up 238 daysthen the machine probably did not reboot overnight. The user’s application may have restarted, the network may have dropped, or someone may be describing the symptom poorly. That happens. Tickets are not sworn testimony.
uptime also tells you if there are logged-in sessions:
3 usersThat does not always mean three humans are actively typing. It might include SSH sessions, terminal multiplexers, or stale sessions. But if you are about to restart something, it is a hint to check who is on the box first.
Use:
whoor:
wbefore you stomp into a server like help desk at 4:59 p.m. with three tickets still breathing down your neck.
What load average means
The load average numbers are usually the confusing part:
load average: 0.22, 0.35, 0.41Those three numbers are system load over different windows:
| Number | Window | Beginner translation |
|---|---|---|
| First | 1 minute | What is happening right now |
| Second | 5 minutes | Recent trend |
| Third | 15 minutes | Longer trend |
A rising first number can mean the system is getting busier now.
Example:
load average: 4.80, 2.10, 0.90That means the last minute is much busier than the last 15 minutes. Something may have just started: a backup, report job, build, import, or runaway process.
A falling pattern looks like this:
load average: 0.80, 2.30, 5.10That suggests the machine was busy earlier, but load is coming down.
That trend matters. A single number without context is how people end up restarting the wrong thing with great confidence.
Compare load average to CPU cores
Load average only makes sense when you know roughly how many CPU cores the system has.
Check CPU count with:
nprocExample:
4That means the system has 4 processing units available.
Very rough beginner rule:
- On a 1-core system, a load around
1.00means it is busy. - On a 4-core system, a load around
4.00means it is busy. - On an 8-core system, a load around
8.00means it is busy.
So this output on a 4-core server is probably fine:
load average: 0.70, 0.85, 0.90This output on a 4-core server deserves attention:
load average: 7.40, 6.90, 6.10It does not automatically mean “CPU is maxed.” Linux load includes processes waiting for CPU and, depending on the situation, tasks waiting on disk or uninterruptible I/O. But it does mean the system has a queue forming somewhere.
That is your cue to investigate, not your cue to mash restart like it owes you money.
A simple help desk workflow for high load
When someone reports “the Linux server is slow,” start with the basics.
First, confirm the machine and uptime:
hostname
uptime
Then check CPU count:
nprocNow read the load average against that CPU count.
If the load looks high, check what is running:
topor:
ps aux --sort=-%cpu | headFor memory pressure, check:
free -hFor disk pressure, check:
df -hFor service problems, check:
systemctl status service-name
journalctl -u service-name --since "30 minutes ago"
The point is to build a chain of evidence:
- The box has been up for 12 days.
- Load is 7 on a 4-core system.
- One process is using most of the CPU.
- The service logs show errors starting at 2:10 p.m.
That is a better ticket update than:
“Server slow. Linux weird. Please advise.”
Nobody wants that ticket. Not even the ticketing system.
How to read common uptime examples
Here are a few realistic examples.
Example 1: normal-looking server
09:10:44 up 22 days, 1:03, 1 user, load average: 0.12, 0.18, 0.20On most systems, that looks calm. The server has not rebooted recently, only one session is logged in, and load is low.
Next step: if a user reports slowness, look outside system load. Check the app, network path, database, browser, or whatever system they actually use.
Example 2: recent reboot
09:10:44 up 8 min, 1 user, load average: 0.88, 0.46, 0.18The uptime is only 8 minutes. That is the story.
Next step: check reboot reason, updates, kernel logs, cloud provider events, or whoever has access to the server. You are not accusing anyone yet. You are just making the timeline less mushy.
Useful commands:
last reboot
journalctl -b -1
journalctl -b -1 shows logs from the previous boot on many systemd systems. If it returns nothing, log retention may be limited.
Example 3: load spike happening now
09:10:44 up 41 days, 3 users, load average: 9.80, 4.20, 1.50The one-minute number is much higher than the five-minute and fifteen-minute numbers. Something is happening right now.
Next step: check active processes:
top
ps aux --sort=-%cpu | head
Also check whether a scheduled job started:
systemctl list-timers
crontab -l
If this is a shared server, also check who is logged in:
wDo not assume malice. Sometimes the culprit is a legitimate report, backup, index rebuild, or a coworker running grep against the known universe.
Example 4: sustained high load
09:10:44 up 41 days, 1 user, load average: 8.10, 8.30, 8.20All three numbers are high and close together. That means load has been high for a while.
Next step: check CPU, memory, disk I/O, and services. Start with:
top
free -h
df -h
If CPU does not explain it, disk I/O may be involved. Beginner-friendly tools vary by distro, but these are common:
iostat
vmstat 1
If iostat is not installed, do not install random packages on a production server just to look busy. Ask or use the tools already approved in that environment.
The logged-in users number can mislead you
uptime might show:
4 usersThat does not always mean four people are actively working.
Check details with:
whoor:
wYou might find:
- Your SSH session
- A coworker’s SSH session
- A stale terminal session
- A terminal multiplexer session like
tmux
Before restarting services, especially on a box other people use, this is a courtesy check. It is also a self-preservation check. “I did not know you were connected” is a weak defense when someone was running a maintenance task.
Beginner mistakes with uptime
The first mistake is reading load average without checking CPU count.
A load of 2.00 is very different on a tiny 1-core VPS than on a 16-core server. Always compare it with nproc.
The second mistake is assuming high load always means high CPU.
Sometimes the system is waiting on disk or stuck on I/O. If top does not show a clear CPU hog, keep investigating instead of forcing the facts to match your first guess.
The third mistake is ignoring trend.
These are not the same:
load average: 8.00, 2.00, 0.50and:
load average: 8.00, 8.00, 8.00The first one may be a spike. The second one is sustained pain.
The fourth mistake is using uptime as proof by itself.
uptime can tell you the box rebooted. It cannot tell you the cause without more logs. It can tell you load is high. It cannot tell you which app is guilty without checking processes and services.
A ticket note you can actually paste
If you are updating a slow-server ticket, write something like this:
Checked
uptime: server has been up for 12 days. Load average is7.4, 6.9, 6.1on a 4-core host, so load is above normal. Checking top CPU processes and service logs next.
Or:
Checked
uptime: server has been up for 8 minutes, so a recent reboot did happen. Reviewing previous boot logs and maintenance history next.
That kind of note makes you sound calm, specific, and useful. Which is the whole game.
Practice uptime before the ticket is on fire
The best time to learn uptime is not during a production slowdown with three people asking for updates in Slack.
Practice the habit:
hostname
uptime
nproc
free -h
df -h
Then explain what you see in one sentence.
Shell Samurai is good for this because you can drill the command pattern without worrying that one typo is going to upset a real server. Practice reading uptime, load, memory, and disk together until the flow feels boring. Boring is good. Boring means your hands work when the ticket is annoying.
Practice beginner Linux troubleshooting in Shell Samurai.
Quick reference
Use this as your beginner uptime checklist:
uptime
nproc
who
w
top
free -h
df -h
Ask:
- Did the server reboot recently?
- How many sessions are logged in?
- Is one-minute load rising or falling?
- Is load high compared with CPU count?
- Do CPU, memory, disk, or service logs explain the symptom?
uptime is not flashy. It is not a full monitoring system. It is a fast first read, and fast first reads are exactly what help desk and beginner sysadmin work needs.
Practice This in a Real Terminal
Shell Samurai gives you safe Linux missions so the commands actually stick. Chapter 1 is free; the full practice path is a one-time purchase, not another subscription.