Linux tail Command for Beginners: Follow Logs Safely
The Linux tail command shows the last lines of a file.
Quick version:
tail file.logThat prints the last 10 lines by default.
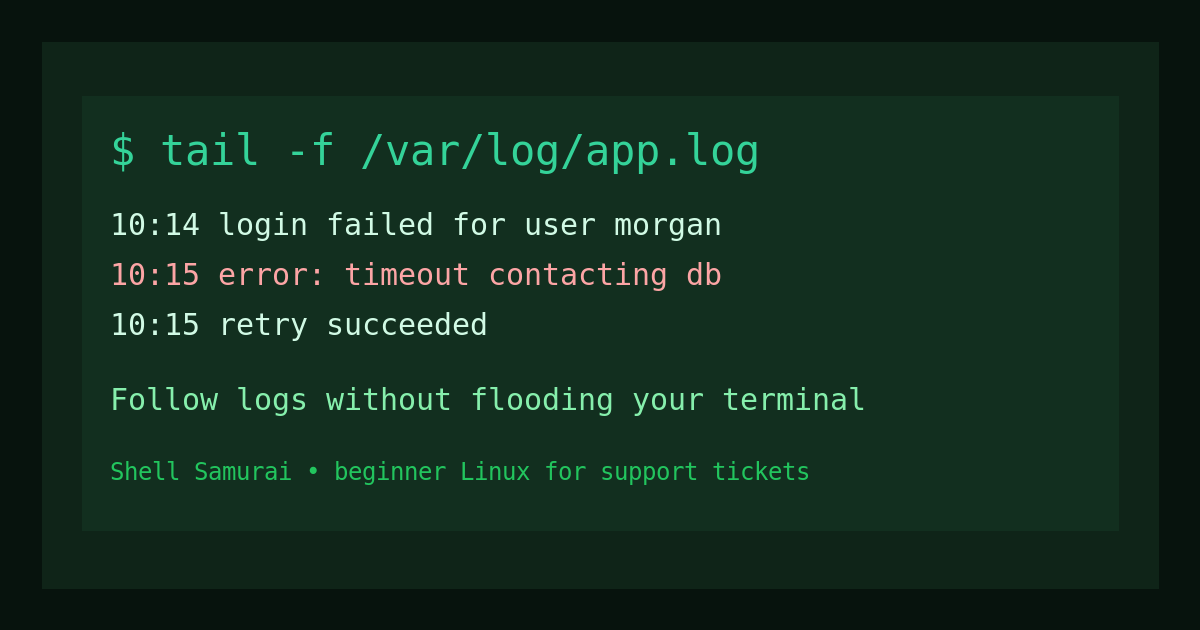
The version help desk techs and junior admins usually care about is this:
tail -f /var/log/syslogThat follows the file as new lines are added, which is useful when you are watching logs while someone tries to sign in, restart a service, upload a file, or reproduce a weird error that only happens when the VP is standing behind them.
This guide covers the practical beginner version of tail: reading the end of a file, choosing how many lines to show, following live logs safely, combining tail with grep, and knowing when less, journalctl, or a different tool is the better answer.
Quick answer: use tail to read the newest lines
To show the last 10 lines of a file:
tail app.logTo show the last 50 lines:
tail -n 50 app.logShorter version:
tail -50 app.logTo follow new lines as they appear:
tail -f app.logTo stop following a file, press:
Ctrl+CBeginner rule: use tail when the newest lines matter. If you need to search the whole file, use grep. If you need to page around without flooding your terminal, use less. If you need systemd service logs, journalctl may be cleaner.
Why tail matters in real support work
A lot of support tickets are really “what happened most recently?” tickets.
Examples:
- A web app started returning 500 errors.
- A user says they cannot log in.
- A backup job just failed.
- A service was restarted and you need to see whether it came back cleanly.
- A script wrote an error five seconds ago and nobody copied it.
Logs are usually appended to the end of a file. That means the newest events are at the bottom. Opening the whole file in an editor is slow, noisy, and sometimes a terrible idea if the log is huge. tail lets you look at the part that is most likely to matter first.
A realistic help desk moment: someone says, “I just tried it again and it failed.” Instead of downloading a 900 MB log file or scrolling like you are trying to beat a casino machine, you can run:
tail -n 100 /var/log/app/app.logNow you are looking at the last 100 lines, which is usually enough to see the recent error without turning your terminal into confetti.
Basic tail examples
Create a small practice file:
printf "line 1\nline 2\nline 3\nline 4\nline 5\n" > sample.logShow the end of it:
tail sample.logFor a tiny file, you will see the whole thing. For a large file, you only get the last 10 lines.
Ask for a specific number of lines:
tail -n 3 sample.logOutput:
line 3
line 4
line 5
The -n flag means “number of lines.” The older shorthand works too:
tail -3 sample.logBoth are common. I prefer -n 3 in documentation because it is easier for beginners to read, but you will see both in the wild.
Follow a log with tail -f
The -f flag means follow. It keeps tail running and prints new lines as the file grows.
tail -f /var/log/syslogOn some Linux distributions, common logs may be in different places:
tail -f /var/log/auth.log
sudo tail -f /var/log/nginx/error.log
sudo tail -f /var/log/apache2/error.log
You may need sudo for protected logs. Do not automatically add sudo to everything like hot sauce. Try the safe command first, then use sudo when permissions require it and you know why.
A normal workflow looks like this:
sudo tail -f /var/log/nginx/error.logThen ask the user or app owner to reproduce the problem. If a new error appears right when they click the broken thing, you have a much better clue than “it is probably DNS,” which is the IT version of blaming the weather.
To stop the live follow:
Ctrl+CIf you forget that part, tail -f can look like your terminal is stuck. It is not stuck. It is waiting for more lines.
Use tail with grep to filter noise
Live logs get loud fast. You can pipe tail into grep when you only care about certain lines.
sudo tail -f /var/log/auth.log | grep -i failedThat follows the auth log and only prints lines containing failed, ignoring capitalization.
Another example:
tail -f app.log | grep -i "database"This can help when a log is full of harmless background chatter and you are hunting a specific error.
One warning: if you pipe through grep, buffering can sometimes make output feel delayed depending on the command and environment. If nothing appears, do not assume the log is clean immediately. Test with a broader search or check the raw tail -f output too.
Follow a rotated log safely
Logs often rotate. That means app.log may become app.log.1, and a new app.log gets created. Plain tail -f follows the file handle it already opened. In some rotation setups, that means it can keep watching the old file instead of the new one.
For many support situations, use:
tail -F app.logCapital -F is like follow by name. It handles common log rotation cases better.
Use it when you are watching a log that may rotate while you are troubleshooting:
sudo tail -F /var/log/nginx/access.logBeginner translation: lowercase -f is fine for basic following. Capital -F is often better for real log files that might get renamed and recreated.
Check multiple files at once
tail can read more than one file:
tail -n 20 app.log worker.logIt will label each file so you know which output came from where.
You can also follow multiple logs:
tail -f app.log worker.logThis is useful when an app has one log for web requests and another for background jobs. It is also how you create a wall of text that makes everyone in the room squint, so use it carefully. Start with the smallest set of logs that could explain the ticket.
Common beginner mistakes with tail
Mistake 1: using cat on huge logs
This is the classic beginner move:
cat giant-production.logThat dumps the whole file into your terminal. It is rarely helpful. Start with:
tail -n 100 giant-production.logIf you need to search the file:
grep -i error giant-production.logIf you need to browse it:
less giant-production.logMistake 2: forgetting Ctrl+C
If you run:
tail -f app.logIt keeps running. That is the point. Stop it with Ctrl+C when you are done.
Mistake 3: watching the wrong log
Before you stare at a log for five minutes, confirm the service or app actually writes there. Check the app config, service docs, or systemd unit. For systemd services, this may be better:
journalctl -u service-name -fFor example:
sudo journalctl -u nginx -fThat follows the journal for a service instead of a plain file.
Mistake 4: using sudo without thinking
Some logs require admin access. That does not mean every command needs root. Run the least privileged command that works. When you do need sudo, be specific:
sudo tail -n 50 /var/log/auth.logThat is much safer than opening a root shell and poking around until something looks interesting.
A help desk workflow for tail
Here is a simple ticket-friendly workflow.
The ticket says: “User gets an error when signing into the internal app.”
- Confirm the approximate time of the failure.
- Find the relevant log.
- Show the newest lines.
- Follow the log while the user reproduces the problem.
- Copy the relevant error into the ticket.
- Stop following the log.
Commands might look like this:
cd /var/log/internal-app
ls -lh
tail -n 100 app.log
tail -f app.log
If the log is noisy:
tail -f app.log | grep -i "login\|auth\|error\|failed"Do not paste 400 lines into the ticket. Nobody wants a novel where the plot is “Java stack trace.” Paste the timestamp, error line, relevant request ID, and what the user was doing.
tail vs less vs grep vs journalctl
Use this quick table:
| Tool | Use it when |
|---|---|
tail | You need the newest lines of a file. |
tail -f | You need to watch new lines live. |
less | You need to browse a file without dumping it. |
grep | You need to search for matching text. |
journalctl | You need systemd service logs. |
The tools work together. A calm support workflow often starts with tail, uses grep to filter, uses less when you need context, and uses journalctl when the service logs are in the systemd journal.
Practice commands
Try these in a safe folder:
mkdir tail-practice
cd tail-practice
printf "started\nconnected\nwarning: slow response\nerror: timeout\nrecovered\n" > app.log
tail app.log
tail -n 2 app.log
tail -f app.log
In another terminal, add a new line:
echo "new login attempt" >> app.logYou should see it appear in the terminal running tail -f.
If you only have one terminal, skip the live-follow part for now and practice reading line counts:
tail -n 1 app.log
tail -n 3 app.log
Then combine it with grep:
tail -n 5 app.log | grep -i errorWhere Shell Samurai fits
tail is not a flashy command. That is good. Most real command-line confidence comes from boring commands used correctly under mild pressure: read the log, filter the noise, avoid changing random files, and stop the command when you are done.
If you want a safer place to build that muscle memory, practice Linux basics in Shell Samurai. It is better to learn how tail, grep, less, and journalctl fit together before a real outage turns your terminal into a group project.
FAQ
What does tail do in Linux?
tail prints the last lines of a file. By default, it shows the last 10 lines.
How do I show the last 100 lines of a file?
Use:
tail -n 100 filenameWhat does tail -f do?
tail -f follows a file and prints new lines as they are added. It is commonly used for watching live logs.
How do I stop tail -f?
Press Ctrl+C.
Should I use tail or journalctl for logs?
Use tail for normal log files. Use journalctl when the service logs are managed by systemd, especially with commands like journalctl -u service-name -f.
Practice This in a Real Terminal
Shell Samurai gives you safe Linux missions so the commands actually stick. Chapter 1 is free; the full practice path is a one-time purchase, not another subscription.